Casey Wagner · 26 October 2026
Insights from Integrated Educational Databases Reveal Threshold Dynamics in Merit-Based Student Support Programs
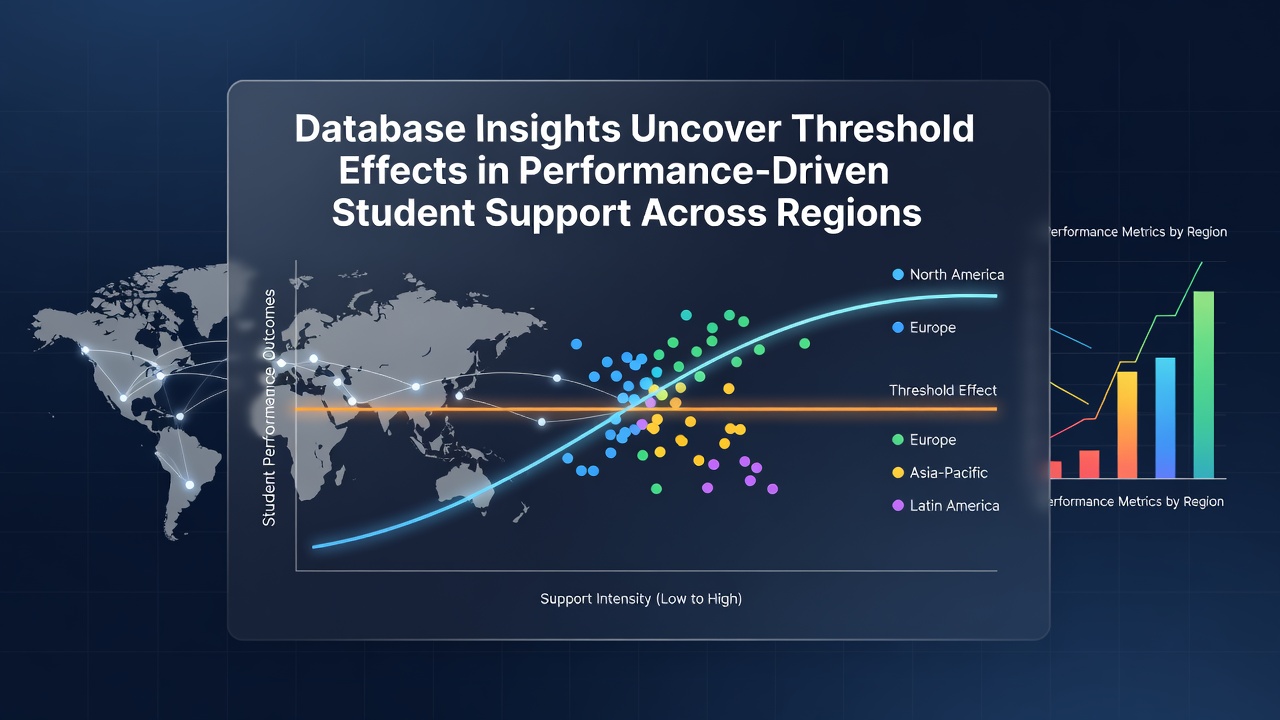
Analyses of large-scale educational databases continue to identify threshold effects where small variations in academic performance trigger substantial shifts in the allocation of performance-driven student support, and these patterns appear consistently across multiple regions according to data compiled through 2026. Researchers examining records from integrated systems note that support mechanisms often activate or intensify only after students reach specific performance benchmarks, creating nonlinear outcomes in resource distribution. In October 2026 fresh data releases from multi-country repositories allowed for updated comparisons that highlighted how these thresholds vary by national policy frameworks yet produce similar discontinuity patterns in aid receipt.
Defining Threshold Effects in Performance-Driven Support
Threshold effects occur when support eligibility or funding levels change abruptly at particular performance points, such as grade averages or standardized test scores, rather than scaling gradually with incremental improvements. Database queries across European and North American datasets show that aid amounts remain stable below certain cutoffs but jump significantly once students surpass them, and this structure influences both retention rates and enrollment decisions in measurable ways. Observers note that such designs aim to concentrate resources on higher performers, yet the resulting data patterns indicate clustering of students just above or below key lines where marginal gains yield outsized benefits.
Regional Variations in Threshold Patterns
European databases covering Central and Western countries demonstrate thresholds tied to national examination results that determine scholarship renewals, whereas North American records link thresholds more frequently to cumulative GPA milestones within institutional aid packages. Australian longitudinal files reveal additional layers where performance bands interact with regional equity adjustments, producing distinct cutoff points for supplementary grants. Data compiled through shared platforms indicates that regions with centralized funding models exhibit sharper threshold discontinuities compared with decentralized systems where institutions set their own benchmarks.
Evidence from Recent Database Integrations
Integrated repositories now combine anonymized student records with funding histories spanning multiple years, enabling analysts to track how crossing performance thresholds correlates with degree completion timelines. Figures from these sources indicate that students positioned near thresholds show elevated rates of strategic course selection aimed at securing or maintaining aid eligibility. In one documented case across several jurisdictions, database tracking revealed that a 0.2 grade point increase near the cutoff corresponded with a 15 percent rise in continued support receipt during the subsequent academic year. Such findings emerge from queries that isolate performance bands and compare outcomes before and after threshold crossings.
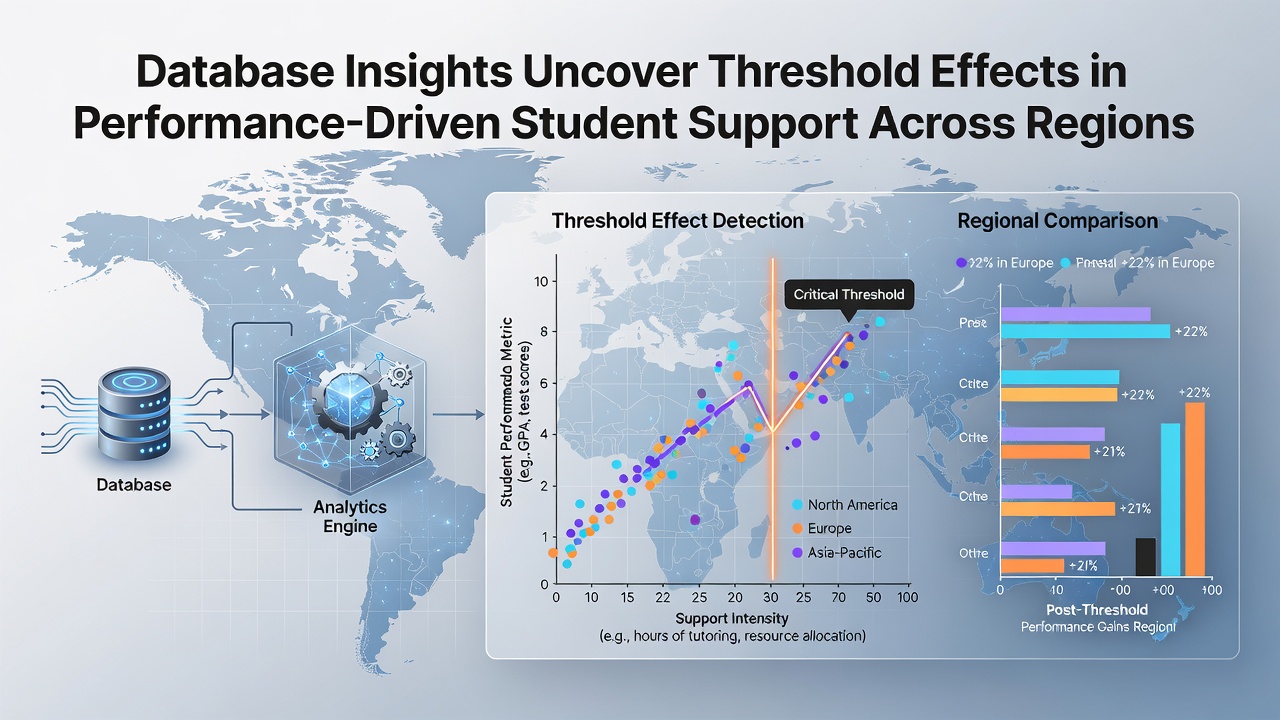
What's interesting is how October 2026 updates incorporated additional variables such as socioeconomic indicators alongside performance metrics, allowing finer mapping of threshold interactions with background factors. Researchers at various institutions report that these expanded datasets reduce previous gaps in understanding how support thresholds function differently for first-generation versus continuing students. The reality is that performance-driven models produce measurable bunching effects visible in histogram distributions of aid recipients, where student counts spike immediately above eligibility lines.
Case Examples Across Jurisdictions
Take records from one multi-region study where Canadian provincial databases were cross-referenced with European counterparts; analysts identified parallel threshold behaviors in which aid renewal hinged on maintaining scores above the 75th percentile equivalent. Another integration involving U.S. state-level data showed similar clustering when performance metrics determined access to performance grants, adn the patterns held after controlling for institutional selectivity. Those who've examined the files note that October 2026 releases included refined time-series elements that track students across threshold events and subsequent labor market entries.
Implications for Resource Distribution
Database evidence suggests that threshold structures shape institutional behaviors as well, with universities adjusting advising practices to help students navigate cutoff points. According to OECD education indicators, countries employing performance-linked funding report varying degrees of concentration in support awards around benchmark scores. The National Center for Education Statistics in the United States provides parallel figures showing how aid receipt rates change at specific GPA levels within state programs. These sources together illustrate how threshold effects concentrate resources yet also create zones of uncertainty for students operating near boundaries.
Conclusion
Continued expansion of integrated educational databases supplies clearer pictures of how performance thresholds operate within student support systems across regions, and October 2026 data additions further refined understanding of these dynamics. Patterns extracted from the records demonstrate consistent nonlinear responses to performance metrics, with implications for both individual trajectories and aggregate funding flows. Analysts continue to refine query methods that isolate threshold locations and measure their downstream effects on attainment and equity metrics, providing ongoing factual input for policy calibration without prescribing specific adjustments.